MiXCR quality controls
GIGO principle
MiXCR takes raw sequencing data as input and extracts repertoire information based on the provided parameters and library architecture. Millions of sequencing datasets prepared with hundreds of different wet lab protocols and technologies have been analyzed by MiXCR through the years.
When results of the analysis look poor (high rate of failed alignments, low number of clones etc), there might be only two global reasons:
- wet lab issues (in our experience this covers 90% of cases) or
- wrong analysis settings (this is another 10%).
MiXCR provides a set of instruments allowing to deeply assess the quality of input data and analysis.
Quality checks report
Each preset contains a list of recommended quality checks for this particular type of data. When running MiXCR using analyze command, it will automatically generate the summary and print it to the standard output. One can also use mixcr qc command to export report from .clns file:
mixcr qc clonotypes.clns
  Successfully aligned reads:                           90.027% [OK]
  Off target (non TCR/IG) reads:                        8.28%   [OK]
  Reads with no V or J hits:                            1.63%   [OK]
  Reads with no barcode:                                0.0%    [OK]
  Overlapped paired-end reads:                          92.096% [OK]
  Alignments that do not cover VDJRegion:               7.72%   [WARN]
  Tag groups that do not cover VDJRegion:               4.51%   [OK]
  Barcode collisions in clonotype assembly:             0.090%  [OK]
  Unassigned alignments in clonotype assembly:          1.16%   [OK]
  Reads used in clonotypes:                             78.39%  [WARN]
  Alignments dropped due to low sequence quality:       0.0%    [OK]
  Alignments clustered in PCR error correction:         0.026%  [OK]
  Clonotypes clustered in PCR error correction:         0.022%  [OK]
  Clones dropped in post-filtering:                     0.0%    [OK]
  Alignments dropped in clones post-filtering:          0.0%    [OK]
  Reads dropped in tags error correction and filtering: 7.18%   [WARN]
  UMIs artificial diversity eliminated:                 31.55%  [WARN]
  Reads dropped in UMI error correction and whitelist:  0.58%   [OK]
  Reads dropped in tags filtering:                      6.59%   [WARN]
The full list of available quality checks can be found here.
Alignment summary report
Provides an overview of alignment performance for a list of samples. Example:
mixcr exportQc align *.vdjca alignQc.pdf

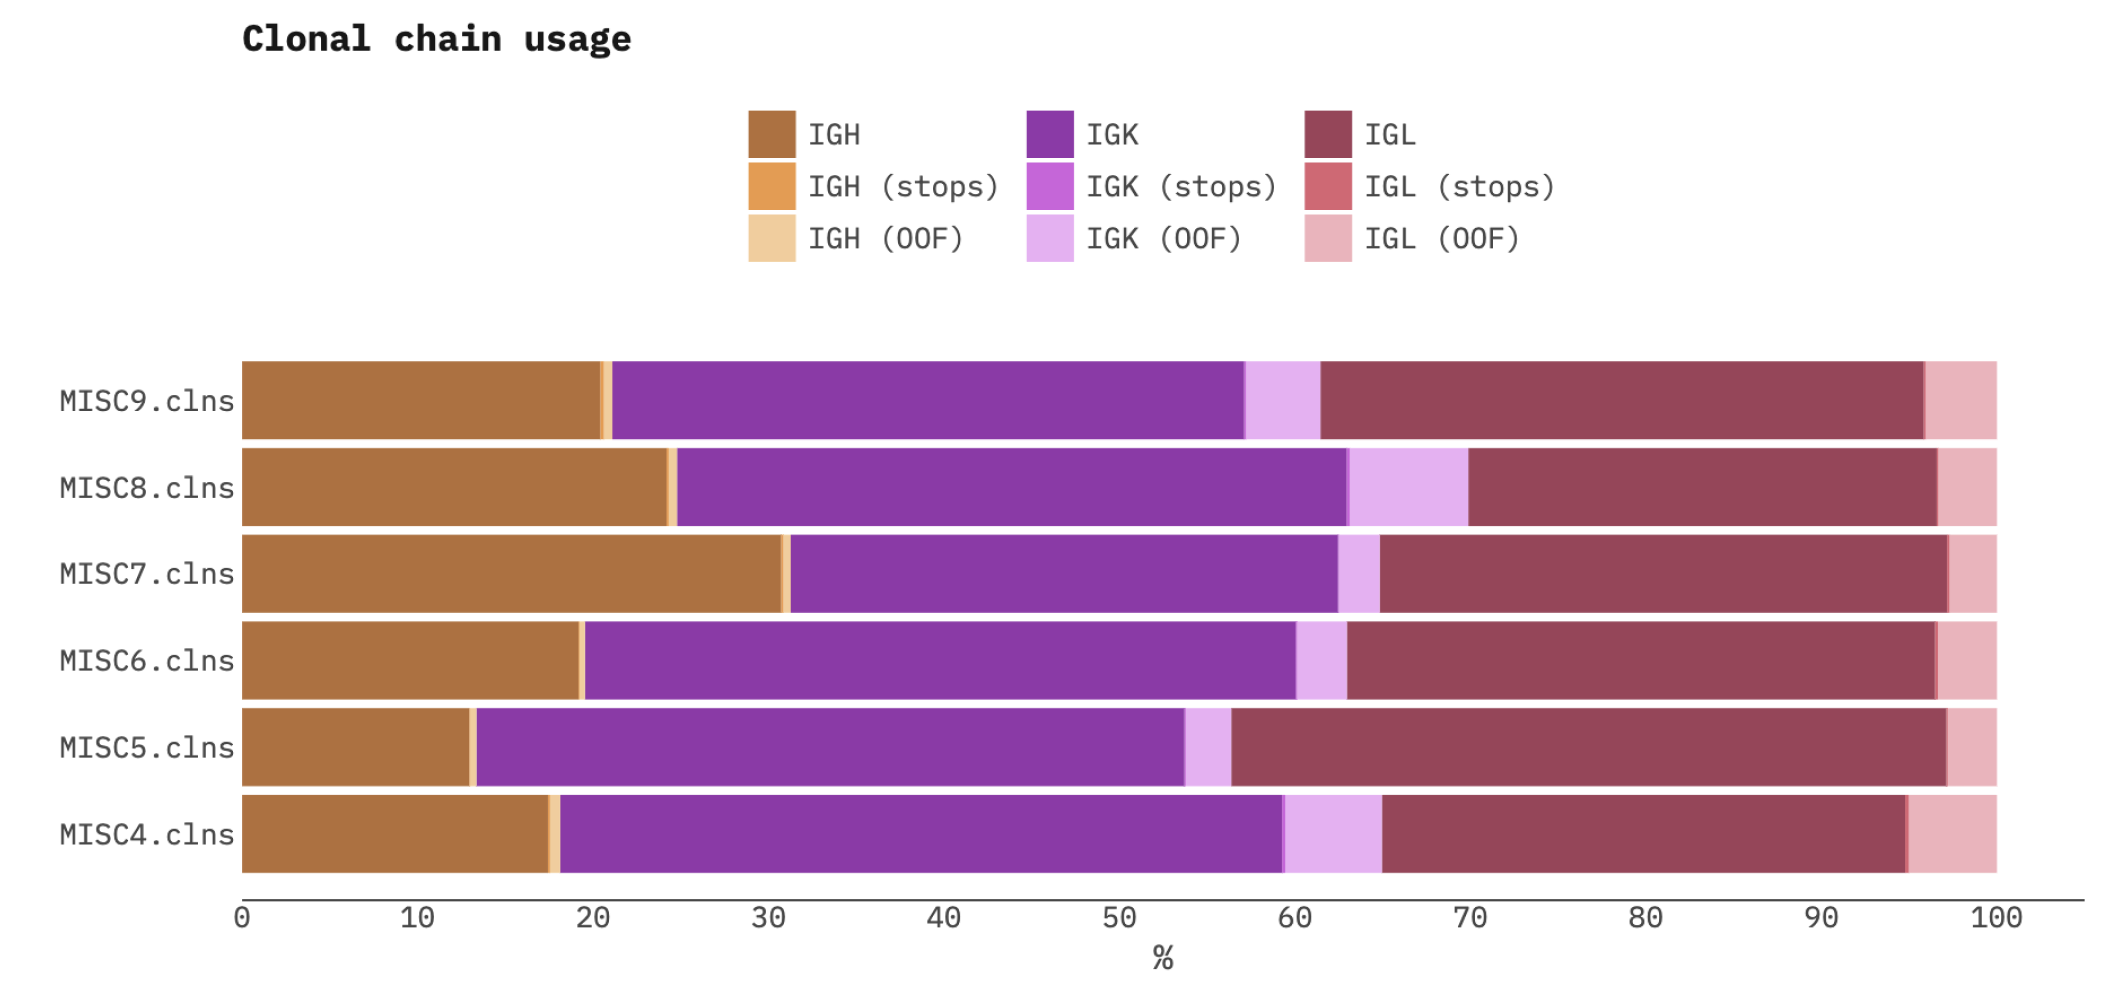
Chain usage summary report
Provides chain usage summary for a list of samples. Example:
> mixcr exportQc chainUsage --hide-non-functional results/*.clns chainUsage.pdf
Barcode coverage report
Provides barcode coverage statistics for sample. For example, for 10x VDJ data:
> mixcr exportQc tags 10x-data.clns barcodesFiltering.pdf


The first plot shows reads per UMI distribution and cut-off threshold used to filter erroneous UMIs. The second plot shows UMI per cell barcode distribution and cut-off threshold used to filter erroneous cell barcodes.
Generic quality issues
Below we elaborate on how to assess the basic quality of the libraries, read MiXCR reports, discover wet lab issues and troubleshoot to get maximum information from the data you have. Check out: